xymax
XYMAX+Yoh
Production Log
A collection of various data visualizations related to Japan’s real estate situation
9/10/2024
How has Tokyo’s land use changed since 1996?

This site observes changes in Tokyo’s land use over time. It explores neighborhood change, and how different land uses have shifted in a quarter century.
4/9/2024
「建物の用途は時間の経過とともにどのように変化したか。」
Features
Changes from 2011 to 2016

Different building uses

3D

Switch to show either top increase or decrease

Change the color scale

2/16/2024

- added 3D mode
- color coded bar charts to match map bin colors
2/13/2024
What has changed from 2011 to 2016?
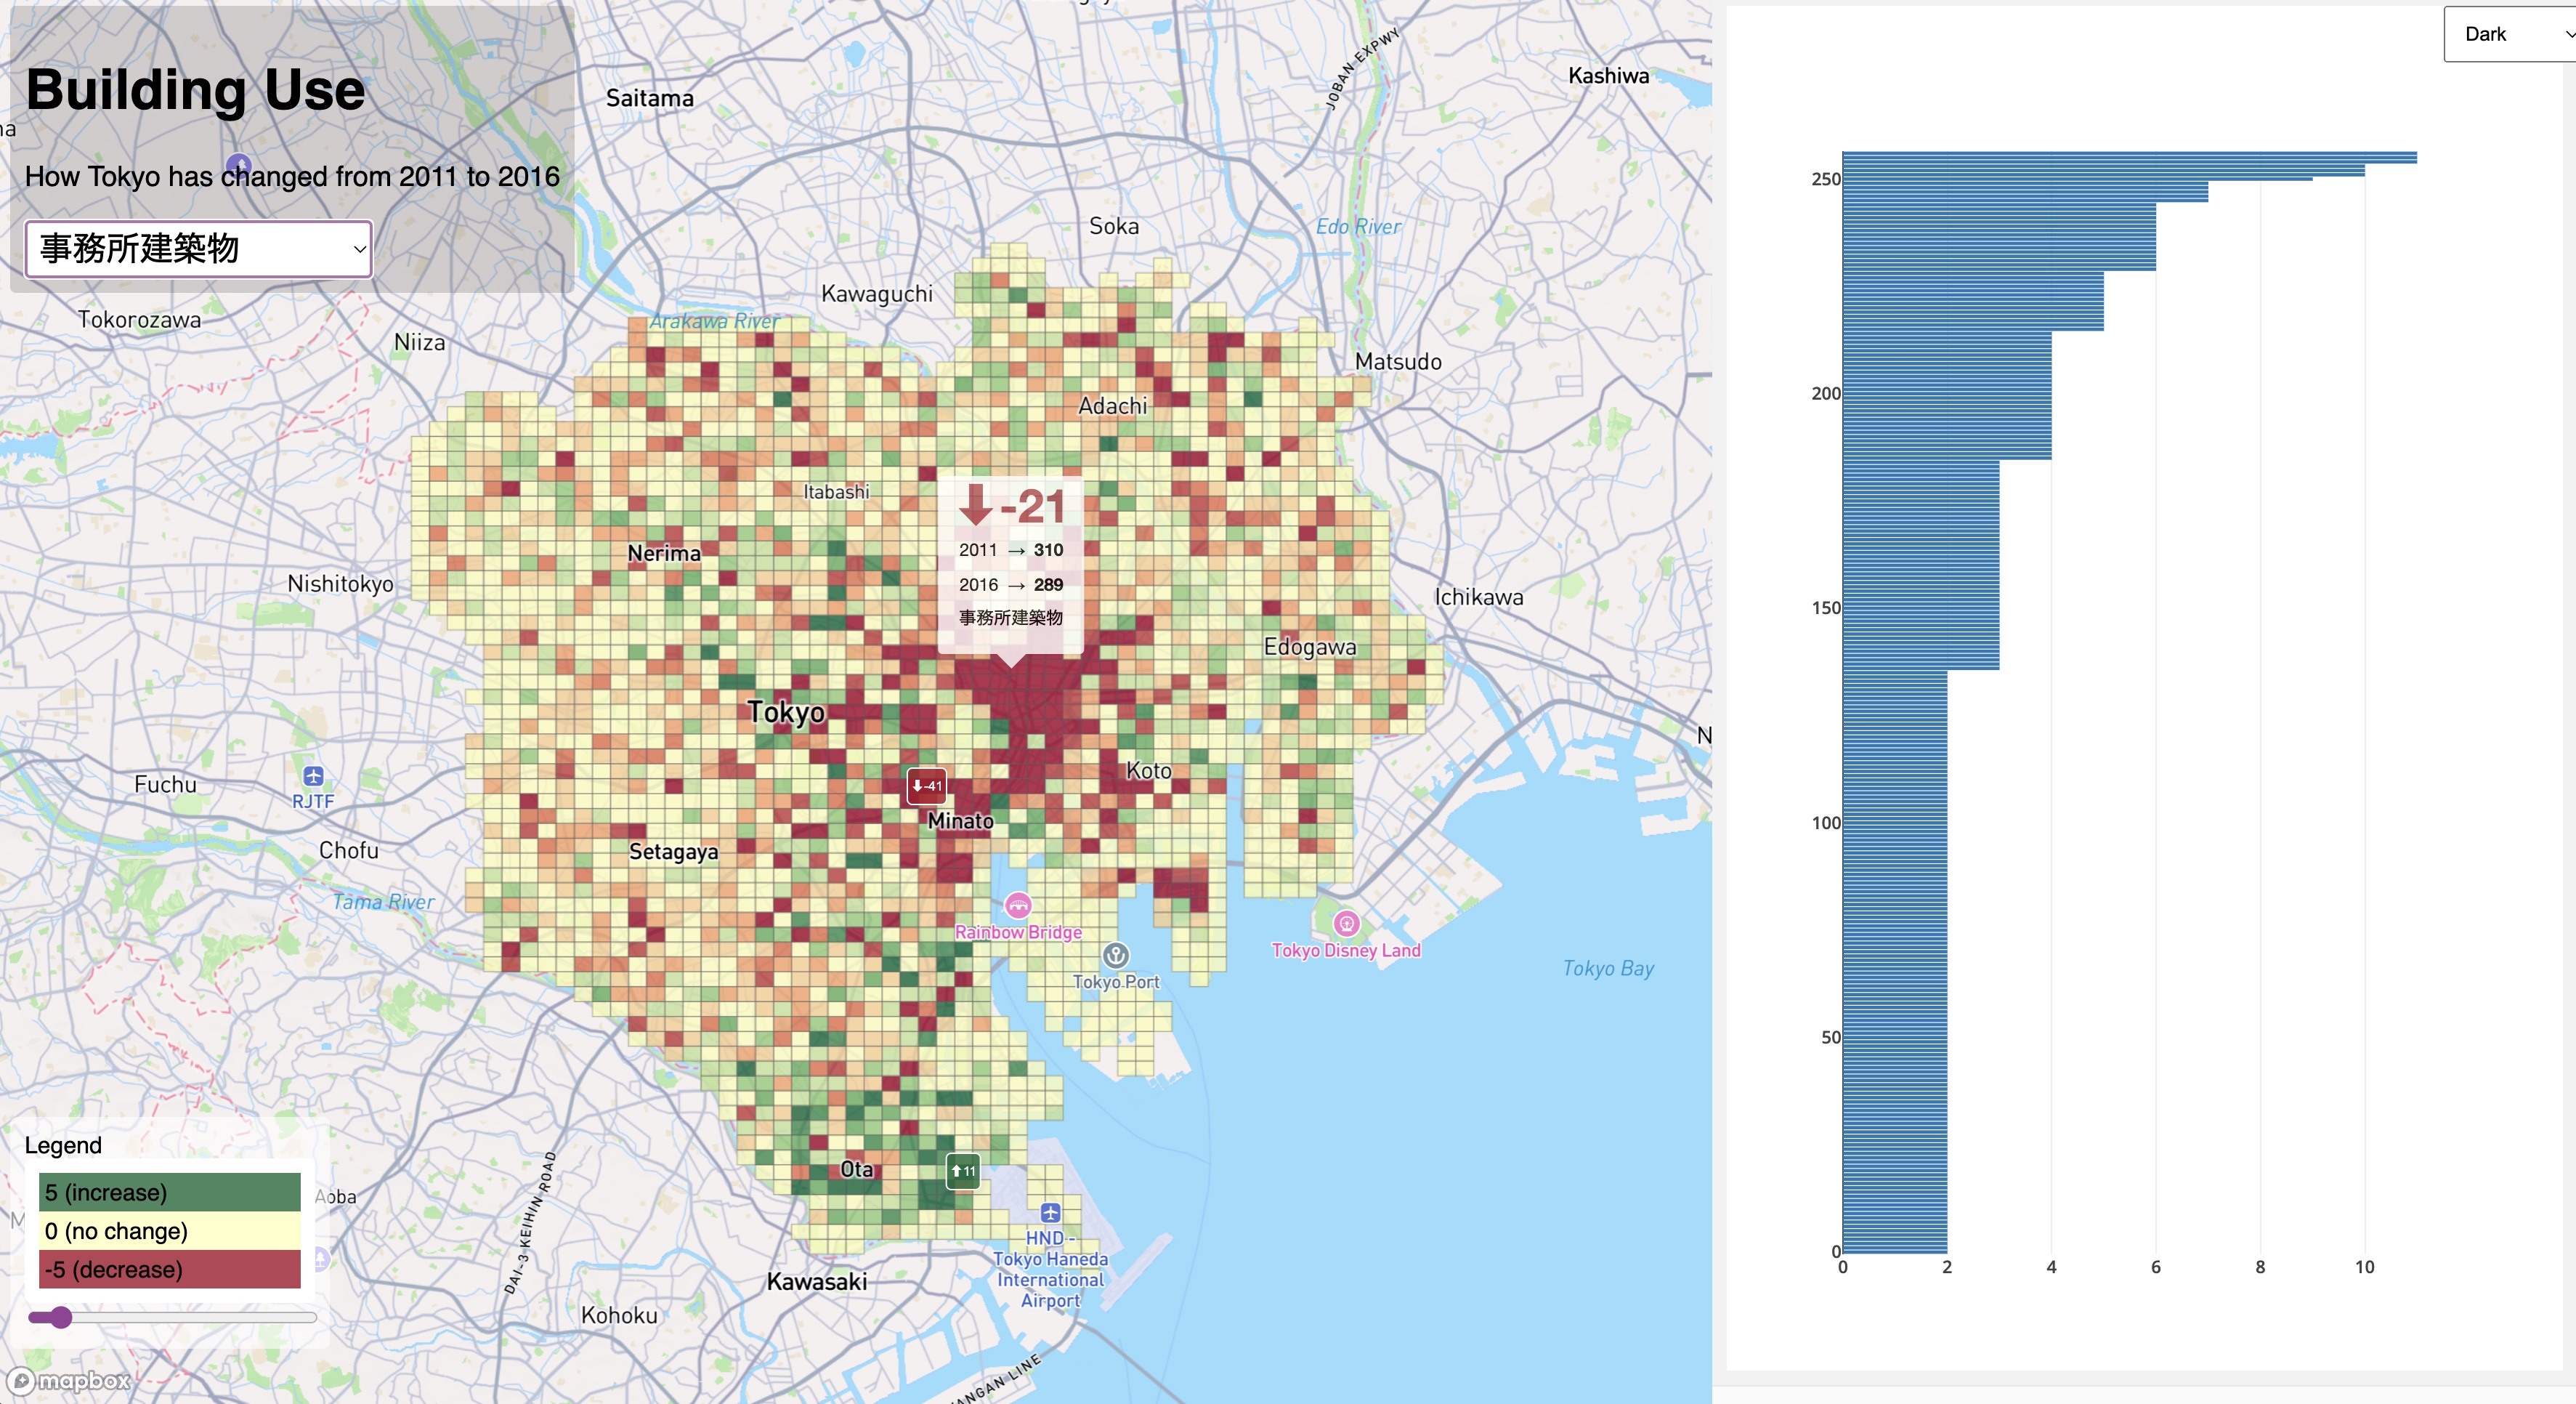
https://yohman.github.io/xymax/buildinguse_change/
1/15/2024
Where are different building uses located in Tokyo?
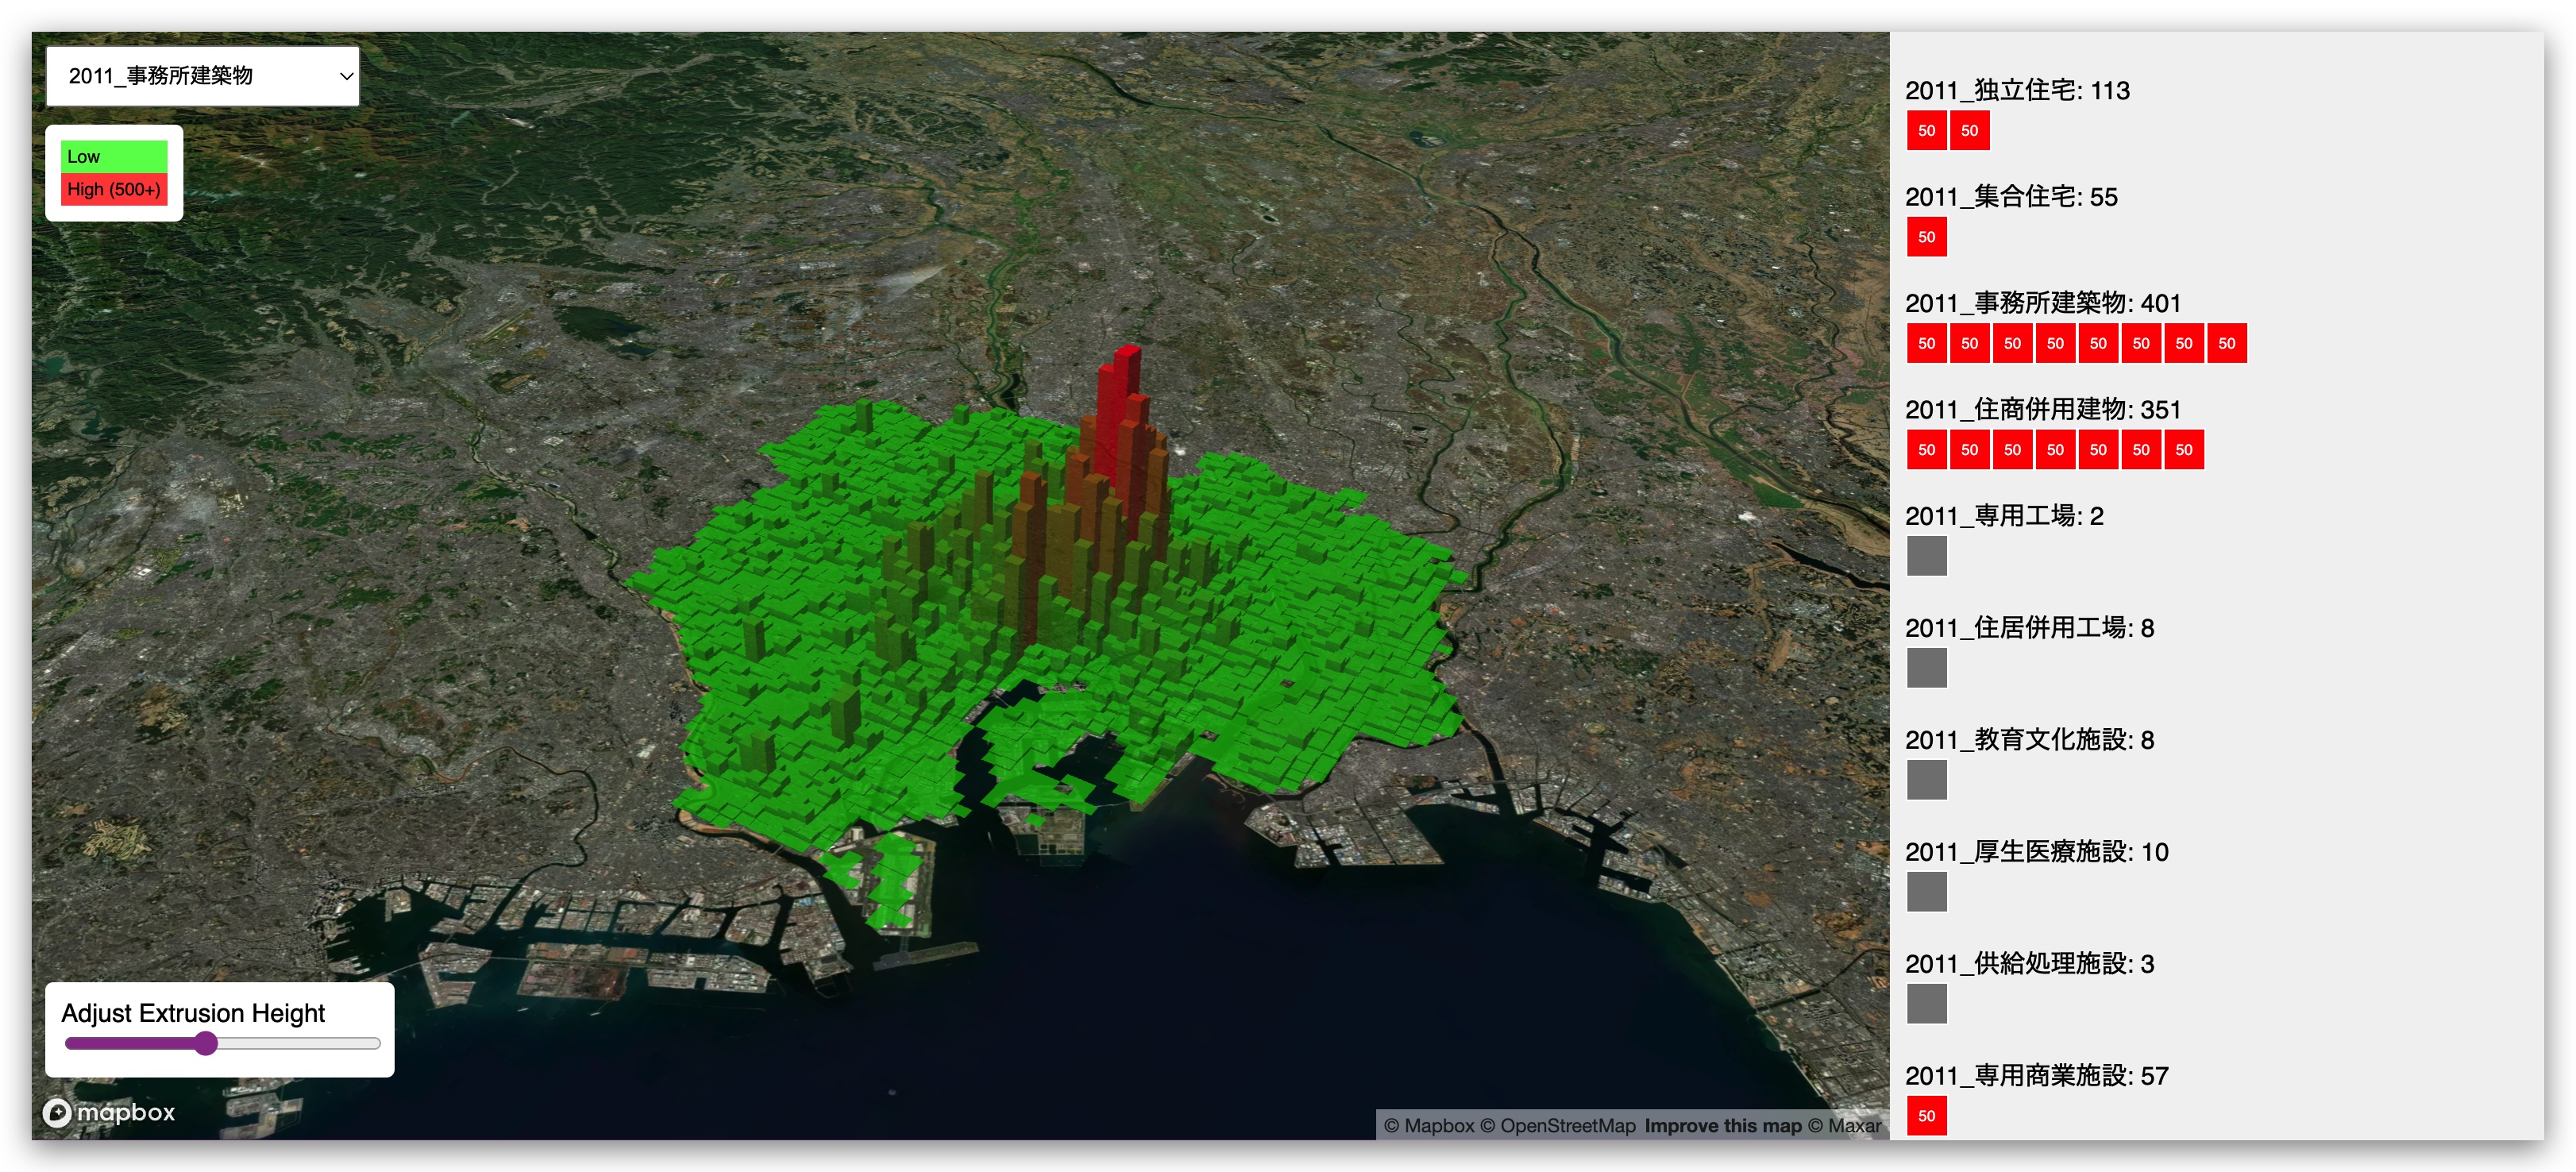
https://yohman.github.io/xymax/buildinguse/
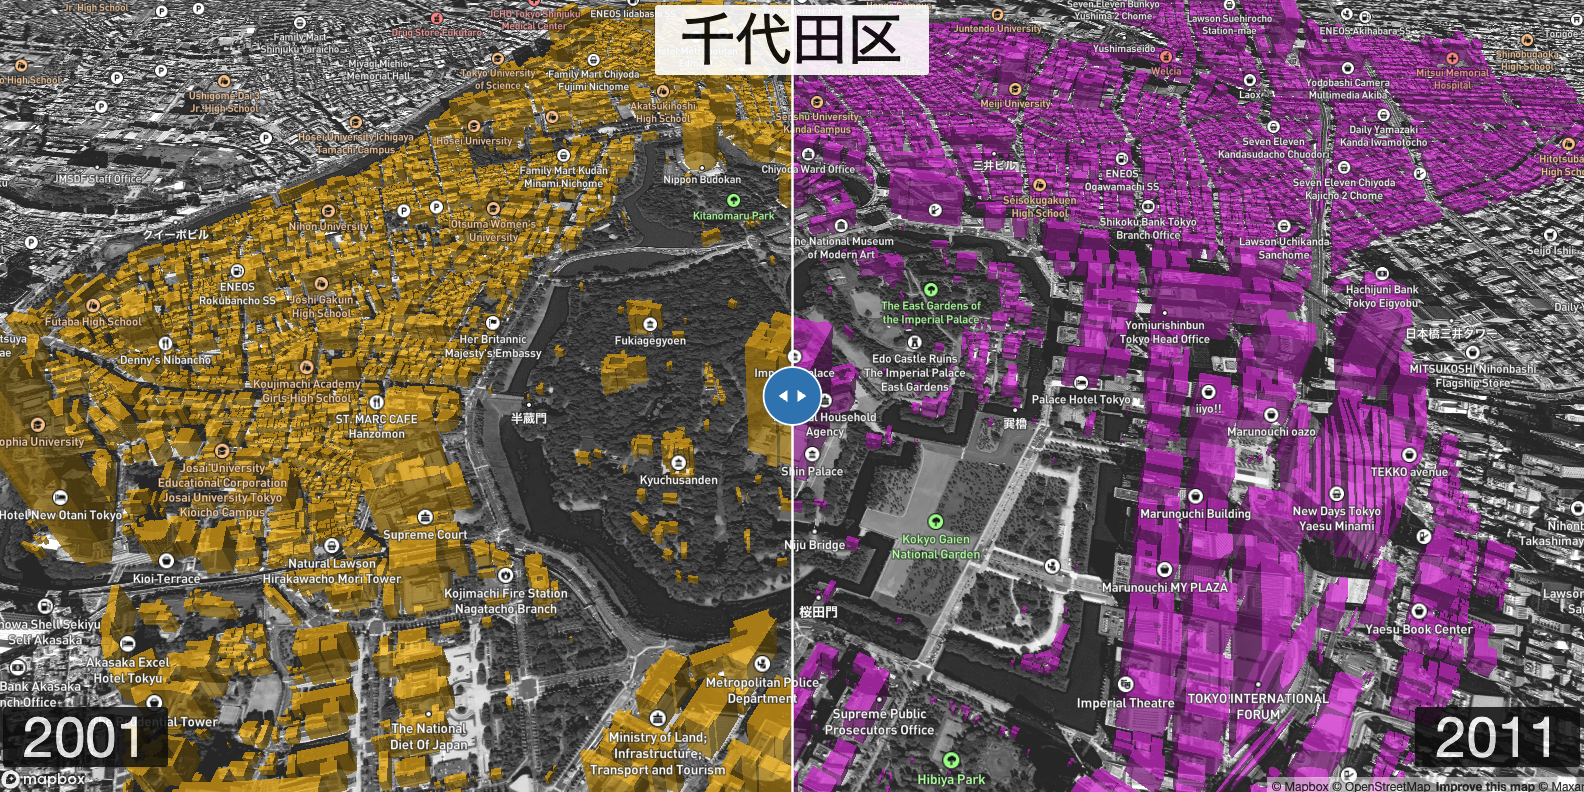
9/16/2023
- Left (yellow): 2001 buildings
- Right (purple): 2011 buildings
- Height is based on area (larger footprint = taller polygon)
- Swipe (left ⇔ right)